
The greatest value of real-time energy monitoring is not just seeing your consumption, but interpreting your home’s unique ‘energy signature’ to predict failures and optimize costs like a data analyst.
- Identify ‘phantom power’ leaks that represent the fixed costs in your energy portfolio.
- Use baseline data to detect anomalies in appliance performance before a catastrophic failure.
Recommendation: Move beyond generic advice by installing CT clamps to access granular, real-time data, enabling precise load shifting and informed decisions about your Ontario hydro plan.
For the tech-savvy Canadian homeowner, the promise of the smart home often boils down to a collection of apps and automated lights. You see the charts, you know your monthly hydro bill, but a deeper understanding of your home’s energy consumption remains elusive. The conventional wisdom is to unplug devices and switch to LEDs, but this only scratches the surface. These are tactical adjustments, not a comprehensive strategy for mastering your household’s energy profile.
This approach misses the fundamental shift that real-time monitoring offers. It’s not just about seeing how much energy you use; it’s about understanding the *character* of that usage. Each appliance, from your fridge to your EV charger, has a distinct electrical fingerprint—an ‘energy signature’. When that signature changes, it’s a leading indicator that something is wrong, often long before the device fails completely. A freezer with a struggling compressor, for example, will show a subtle but steady increase in its energy draw weeks before it stops cooling.
But what if the key wasn’t just reducing consumption, but transforming your home’s electrical grid into a high-fidelity data stream? This article departs from generic tips. We will approach your home’s energy like a data analyst, focusing on interpreting signals, detecting anomalies, and making calculated decisions. We’ll explore how to identify costly energy vampires, understand the data from your electrical panel, and leverage rate plans to your financial advantage.
For those who prefer a different kind of visual stimulation, the following video offers a classic performance that provides a moment of levity to complement the data-driven focus of this guide.
To navigate this deep dive into your home’s energy data, we’ve structured this guide to answer the most critical questions. Explore the sections below to learn how to move from passive observation to active energy management.
Table of Contents: Mastering Your Home Energy Data
- Which Devices Are Costing You $20/Month Just by Being Plugged In?
- How to Install CT Clamps in Your Electrical Panel Safely?
- Are You Actually Using Your Solar Power or Selling It Back at a Loss?
- Why Too Many Charts Lead to ‘Alert Fatigue’ and How to Set Useful Notifications
- How Shifting Laundry to 7 PM Saves $150/Year with Granular Tracking
- How to Wire a Minimalist Modern Home for Automation Without Seeing a Single Cable
- How Much Does Charging a Tesla Actually Add to Your Hydro Bill per Month?
- Ultra-Low Overnight vs Tiered Rates: Which Ontario Hydro Plan Fits Your EV Lifestyle?
Which Devices Are Costing You $20/Month Just by Being Plugged In?
Before you can analyze the dynamic signals of your home’s energy use, you must first identify and eliminate the baseline noise. This noise is “phantom power” or “standby power”—the electricity consumed by devices that are turned off but still plugged in. It’s a significant fixed cost in your home’s energy portfolio. According to Hydro One, this seemingly minor drain costs the average Canadian household $150 per year in phantom power. For some homes, this figure can be much higher, easily exceeding $20 per month.
The main culprits are often the electronics that prioritize convenience and connectivity over efficiency. A real-time energy monitor immediately exposes these hidden costs, moving them from an abstract concept to a clear, quantifiable line item on your dashboard. Without this data, you’re simply guessing.
Case Study: The True Cost of Standby in Vancouver
An analysis of typical household electronics reveals the significant impact of standby modes. A single cable box, for instance, continuously consuming 25 watts even when “off” can add $35-40 to your annual hydro bill. For gamers, a console left in “instant-on” mode can be even more costly, potentially adding $50-60 per year to your expenses, all for the convenience of faster startups.
Identifying these devices is the first step. An energy monitor with individual circuit tracking allows you to pinpoint the worst offenders with surgical precision. Common sources of significant phantom load in Canadian homes include:
- Cable and satellite boxes: These devices are notorious for drawing up to 30W continuously, as they are always ready to receive updates or recording commands.
- Gaming consoles: “Instant-on” modes maintain a network connection and keep memory powered, drawing 10-25W at all times.
- Smart home hubs and speakers: Devices like Google Nest or Amazon Echo constantly listen for commands, consuming 3-8W.
- Older microwave ovens and coffee makers: The simple clock display on these appliances can account for a 2-5W constant draw.
By identifying and addressing these constant drains with smart power bars or by simply unplugging them, you establish a true zero baseline. This cleans up your data, making the real-time signatures of active appliances much easier to analyze for anomalies.
How to Install CT Clamps in Your Electrical Panel Safely?
Accessing the granular data needed for true energy analysis requires tapping directly into your home’s electrical nervous system: the main breaker panel. This is accomplished using Current Transformer (CT) clamps, sensors that clip around the main service lines coming into your home. These clamps are the heart of any whole-home energy monitor, measuring the flow of electricity in real-time without altering your home’s wiring. The installation is the critical step that connects your physical infrastructure to your data analytics platform.
This paragraph introduces the concept of CT clamps. To better understand their placement, visualizing the process is key. The illustration below shows how these sensors are carefully fitted within a residential panel.
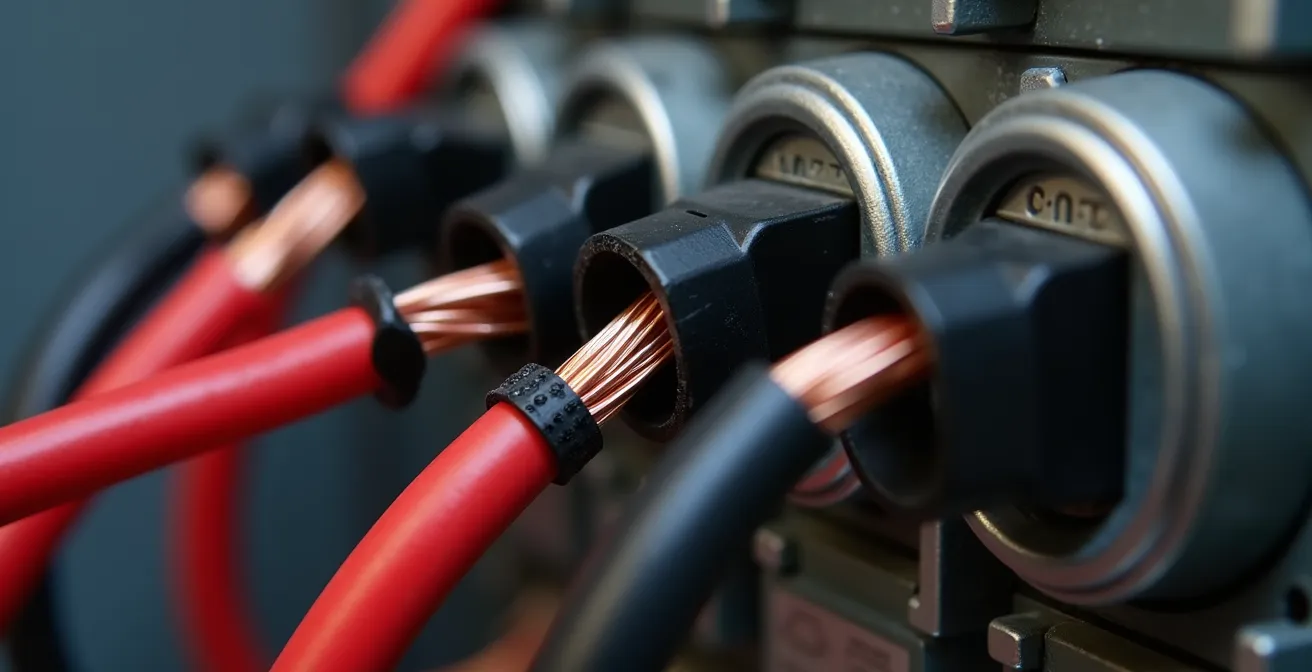
As the image demonstrates, the clamps encircle the main insulated conductors. Safety is paramount during this process. While the installation may seem straightforward for a tech-savvy individual, working inside a live electrical panel carries inherent risks. For this reason, in Canada, it is strongly recommended that the installation be performed by a licensed electrician. An experienced professional can typically complete the entire setup in under 30 minutes, ensuring it is done safely and correctly.
Most modern energy monitors, like the Emporia Vue or Sense, are designed for compatibility with standard North American panels, specifically single main split-phase 120/240V residential panels up to 200A service. This covers the vast majority of Canadian homes. However, one critical constraint to be aware of is the inability to install CT clamps on bus bars, which are common in certain combo panels. Attempting to do so is dangerous and often impossible. A qualified electrician can immediately identify your panel type and determine the correct installation procedure.
Are You Actually Using Your Solar Power or Selling It Back at a Loss?
For homeowners with a photovoltaic (PV) solar array, an energy monitor transcends cost-saving and becomes a critical tool for asset management. Without granular data, you are likely not maximizing the return on your significant investment. The common assumption is that all the power you generate is offsetting your bill equally. The reality is far more complex and involves a concept we can call Kilowatt Arbitrage: strategically using your own generated power to avoid purchasing expensive grid power.
The key issue is the disparity between the price you pay for electricity from the grid and the price you receive for selling your excess solar power back. In most Canadian provinces, net-metering programs credit you for excess generation, but the feed-in tariffs (the rate you’re paid) are often substantially lower than the retail rate. For example, you might avoid buying power at 15¢/kWh during the day, but only get paid 3-5¢/kWh for any excess you export. Selling your power back is, in many cases, a losing proposition.
A real-time energy monitor with solar production tracking makes this transparent. It shows two distinct data streams: what you’re generating and what you’re consuming. The goal is to make these two curves overlap as much as possible. By seeing that you’re exporting 3kW of power at 11 AM on a sunny Tuesday, you can make a data-driven decision to run a high-consumption appliance. You could start the dishwasher, do a load of laundry, or top up your EV, effectively using your own “free” power instead of selling it for pennies.
This practice, known as data-driven load shifting, directly increases the value of your solar array. The monitor provides the real-time feedback loop needed to align your consumption with your production, ensuring every kilowatt-hour generated is used to its maximum financial potential rather than being sold back to the grid at a steep discount.
Why Too Many Charts Lead to ‘Alert Fatigue’ and How to Set Useful Notifications
The initial appeal of an energy monitor is the wealth of data it provides: real-time graphs, historical trends, and device-by-device breakdowns. However, data without insight is just noise. Many homeowners quickly become overwhelmed by the sheer volume of information, leading to “alert fatigue”—a state where constant, non-actionable notifications are ignored, defeating the purpose of the monitor. The key is to improve the signal-to-noise ratio of your alerts.
Instead of generic “high usage” alerts, an effective strategy focuses on setting up notifications based on predictive anomaly detection. This involves using the monitor to establish a baseline ‘energy signature’ for major appliances. Your fridge, for example, has a predictable cycle of compressor activity. A smart alert isn’t triggered by the compressor turning on, but by a change in its pattern—such as running for longer durations or drawing slightly more power than its established baseline. This is a leading indicator that the coils may be dirty, the door seal is failing, or the compressor itself is wearing out.
This approach transforms your monitor from a reactive reporting tool into a proactive diagnostic system. It allows you to catch problems early, schedule preventative maintenance, and avoid costly emergency repairs or catastrophic failures, like a freezer full of spoiled food.
Case Study: Smart Alerts for Proactive Maintenance
Monitoring systems like eGauge empower users to move beyond simple data visualization. By defining custom alerts, a homeowner can receive a text or email notification for specific, unexpected energy events. For example, you could set an alert if your well pump runs for more than 10 minutes continuously (indicating a possible leak) or if your sump pump *doesn’t* run during a heavy rainfall event (indicating a potential failure). These alerts are highly targeted, providing actionable information about costly failures or loss of renewable energy production, allowing you to carry on with your routine while the system watches for meaningful deviations.
To implement this, focus on setting up alerts for:
- Deviations from a baseline: “Alert me if the freezer’s daily consumption increases by 15% week-over-week.”
- Unusual run-times: “Alert me if the air conditioner runs for more than 4 hours continuously.”
- Unexpected activity: “Alert me if the garage circuit shows usage between 1 AM and 5 AM.”
This data-driven approach ensures that when you do get a notification, it’s a high-value signal that warrants your attention, not just more noise.
How Shifting Laundry to 7 PM Saves $150/Year with Granular Tracking
One of the most immediate and tangible benefits of real-time energy monitoring is the ability to execute and verify data-driven load shifting. This means consciously moving high-consumption activities from peak-rate hours to off-peak or mid-peak hours. While the concept is simple, a monitor provides the precise feedback needed to quantify the savings and optimize the behaviour. In provinces with Time-of-Use (TOU) or Ultra-Low Overnight (ULO) rates, like Ontario, this strategy can yield significant savings.
Consider the laundry. A modern electric dryer can draw 3,000 to 5,000 watts. Running it during on-peak hours (e.g., 4 PM on a weekday) can be several times more expensive than running it overnight. A monitor makes this cost difference explicit. You can see the spike in real-time and associate a precise dollar amount to that single load of laundry. This tangible feedback is a powerful motivator for behavioural change.
This paragraph explains the financial benefit of timing your laundry. The image below captures the feeling of smart, energy-conscious living during these cost-effective evening hours.

The introduction of Ontario’s Ultra-Low Overnight rate has created an even greater opportunity for savings. For customers who opt into this plan, shifting energy usage to the overnight period (11 PM to 7 AM) can be highly lucrative. According to an analysis by Electric Autonomy, some customers who can shift their consumption may save a further $90 per year on top of existing savings. By scheduling your dishwasher, EV charger, and laundry to run during this window, you are actively minimizing your energy costs.
A granular tracking system proves the ROI of these actions. It gamifies the process, allowing you to see the direct financial reward of waiting a few hours to press ‘start’. Over a year, these small, data-informed decisions—running three loads of laundry per week overnight instead of in the afternoon—can easily add up to $100-$150 in direct hydro bill savings, turning abstract rate plans into a concrete financial strategy.
How to Wire a Minimalist Modern Home for Automation Without Seeing a Single Cable
A truly intelligent, data-driven home requires a robust and reliable nervous system. While wireless technologies are convenient, for a minimalist aesthetic and maximum reliability, a wired infrastructure is superior. The challenge is achieving this connectivity without the visual clutter of cables. This is not about energy monitoring itself, but about building the foundational infrastructure upon which high-fidelity monitoring and automation systems depend.
The most effective strategy is to plan during a new build or a major renovation. This is the golden opportunity to future-proof the home. The core principle is to run conduits to key locations. Even if you don’t pull a cable through them immediately, having an empty pipe from your utility room to your entertainment center, home office, or key appliance locations provides immense future flexibility. Structured wiring is the professional term for this approach, involving a central hub (a structured media cabinet) where all Ethernet, coaxial, and other low-voltage cables terminate.
For powering a growing number of smart devices, Power over Ethernet (PoE) is a minimalist’s best friend. A single Ethernet cable can provide both a high-speed data connection and electrical power to devices like security cameras, smart home touch panels, and even some sensors. By planning for PoE-enabled switches in your central hub, you eliminate the need for bulky power adapters and extra outlets at the device location.
When wiring is truly not an option, the solution lies in a robust wireless network. A single router is often insufficient for a modern home filled with signal-blocking materials. A mesh Wi-Fi system, with multiple nodes placed strategically throughout the house, ensures a strong and stable connection for all your wireless sensors and devices. Ultimately, the goal is a hybrid approach: hardwire everything that is critical and stationary (like an energy monitor in the panel), and rely on a powerful mesh network for everything else. This creates a seamless, invisible, and highly reliable network for your entire home automation ecosystem.
How Much Does Charging a Tesla Actually Add to Your Hydro Bill per Month?
For new and prospective electric vehicle owners, the most pressing question is often: “What will this do to my hydro bill?” The answer depends entirely on *when* and *at what rate* you charge. An energy monitor removes all guesswork, providing a precise calculation of your EV’s impact on your monthly expenses. This is especially critical in provinces like Ontario, where rate plans create massive cost differences.
The key to affordable EV ownership is home charging during ultra-low-cost periods. With the introduction of Ontario’s Ultra-Low Overnight (ULO) plan, EV drivers have the prospect of charging at home for 2.4 cents per kWh. This is a game-changer compared to on-peak rates that can be more than ten times higher. An energy monitor connected to the EV charger’s circuit allows you to track every kilowatt-hour consumed and verify that you are indeed benefiting from these low rates.
Calculating your monthly cost becomes a simple data analysis exercise rather than a rough estimate. By tracking your charging sessions, you can determine your exact monthly kWh consumption for the vehicle and multiply it by your specific overnight rate. This moves you from abstract manufacturer estimates to personalized, real-world data.
Action Plan: Calculate Your Monthly EV Charging Cost
- Determine your daily driving distance: Log your typical daily kilometers driven for a week to find a realistic average.
- Calculate energy consumption: Use your car’s data or a typical EV efficiency rate (e.g., 20 kWh/100km) to translate distance into kWh used.
- Identify your utility’s overnight rate: Check your hydro bill or provider’s website for your specific TOU or ULO overnight rate (e.g., 2.4¢/kWh for Ontario ULO).
- Factor in charging efficiency loss: Account for a 10-15% energy loss during the charging process. For every 10 kWh your car’s battery receives, you’ve likely pulled 11-11.5 kWh from the grid.
- Calculate total monthly cost: Multiply your total monthly kWh usage (including efficiency loss) by your specific overnight rate to get your final, accurate monthly charging cost.
This process transforms the unknown variable of EV charging into a known, manageable, and optimizable line item in your household budget. It provides the data to prove the economic benefits of driving electric.
Key Takeaways
- Your home’s electricity usage creates a unique ‘energy signature’ that can be analyzed to predict appliance failures before they happen.
- Maximizing the value of solar panels requires data-driven load shifting to prioritize self-consumption over selling power back to the grid at a loss.
- Choosing the right Ontario hydro plan (ULO vs. Tiered) is a critical financial decision for EV owners, and an energy monitor provides the data to make the optimal choice.
Ultra-Low Overnight vs Tiered Rates: Which Ontario Hydro Plan Fits Your EV Lifestyle?
For an Ontario homeowner, especially one with an electric vehicle, choosing the right electricity rate plan is one of the most impactful financial decisions you can make. The choice between Time-of-Use (TOU), Tiered, and the newer Ultra-Low Overnight (ULO) plans can mean a difference of hundreds of dollars per year. An energy monitor is the essential tool for making this decision with data, not intuition. It allows you to model your consumption patterns against each plan to see which is most advantageous for your specific lifestyle.
The Tiered plan is simplest: you pay one price for a block of energy each month and a higher price for anything over that threshold. It benefits those with unpredictable schedules whose consumption is spread evenly throughout the day. The TOU plan incentivizes shifting usage away from on-peak hours (typically weekday afternoons) to cheaper mid-peak or off-peak (evenings and weekends) times. The ULO plan takes this a step further, offering an extremely cheap overnight rate in exchange for a significantly higher on-peak price. This plan is explicitly designed for those who can shift major loads, like EV charging, to the overnight window.
As Brian Bentz, President and CEO of Alectra, notes, this new rate structure is a direct reward for smart energy consumers:
The great thing about this rate option is that it rewards customers who are electric vehicle (EV) users who can charge at home overnight and others who can shift their general electricity use to overnight periods.
– Brian Bentz, President and CEO of Alectra
Without an energy monitor, you’re flying blind. You might assume the ULO plan is best for your EV, but if your family also has high, unavoidable on-peak consumption (e.g., working from home, running medical equipment), the higher peak price could negate your overnight savings. A monitor with advanced software can take your historical usage data and simulate your monthly bill under each of the three plans. This provides a clear, data-backed forecast, allowing you to choose the plan that offers the lowest possible cost for *your* unique energy signature.
The next logical step is to equip your home with a monitoring system and begin transforming your energy data into these actionable, cost-saving decisions.
Frequently Asked Questions About Real-Time Energy Monitoring
Do I need an electrician to install CT clamps in Canada?
While the process itself is often straightforward, working inside a live electrical panel is hazardous. For safety and compliance, it is highly recommended that a licensed electrician performs the installation. A professional can typically complete the job in less than 30 minutes.
What electrical panels are compatible with CT clamp monitors?
Most modern monitors are compatible with standard single main split-phase 120/240V residential electrical panels in North America, for service up to 200A. This covers the majority of Canadian homes, including those with recessed or flush-mounted panels.
Can CT clamps be installed on bus bars?
No. Attempting to install CT clamps around a bus bar is difficult, dangerous, and generally not supported. Many North American homes have combination panels where this might be a concern, which is another reason professional assessment and installation are crucial.